Dynamic Excel Chart Colors January 17, 2006
Did you ever want to have the colors of an Excel bar chart change dynamically with the values of the chart? The code below gives results like those shown below.
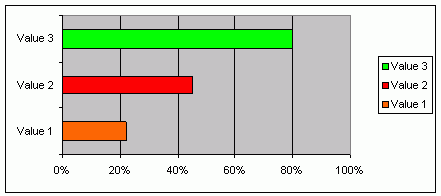
Just place this code in the module of the sheet where the chart(s) are located. Although tested for bar charts, it works for some other types too. Download the demo file.
Private Sub Worksheet_Change(ByVal Target As Range)
    For Each MyChart In ActiveSheet.ChartObjects
        MyVals = MyChart.Chart.SeriesCollection(1).Values
        Set MyPoints = MyChart.Chart.SeriesCollection(1).Points
        i = 1
        For Each p In MyPoints
            v = MyVals(i)
            p.Interior.ColorIndex = ColorScheme(v)
            i = i + 1
        Next
    Next
End Sub

Private Function ColorScheme(v)
    If v < 0.25 Then
        ColorScheme = 46 'Orange
    ElseIf v <= 0.5 Then
        ColorScheme = 3 'Red
    Else
        ColorScheme = 4 'green
    End If
End Function
Comments
looks good
very nice